ARK lightens up on Advanced Micro Devices — $16.2M sold
It was the day's biggest move, and it came from ARKQ and ARKX. Plus the other trades that day and how ARK compares with the market.
Generated from ARK's own holdings data.
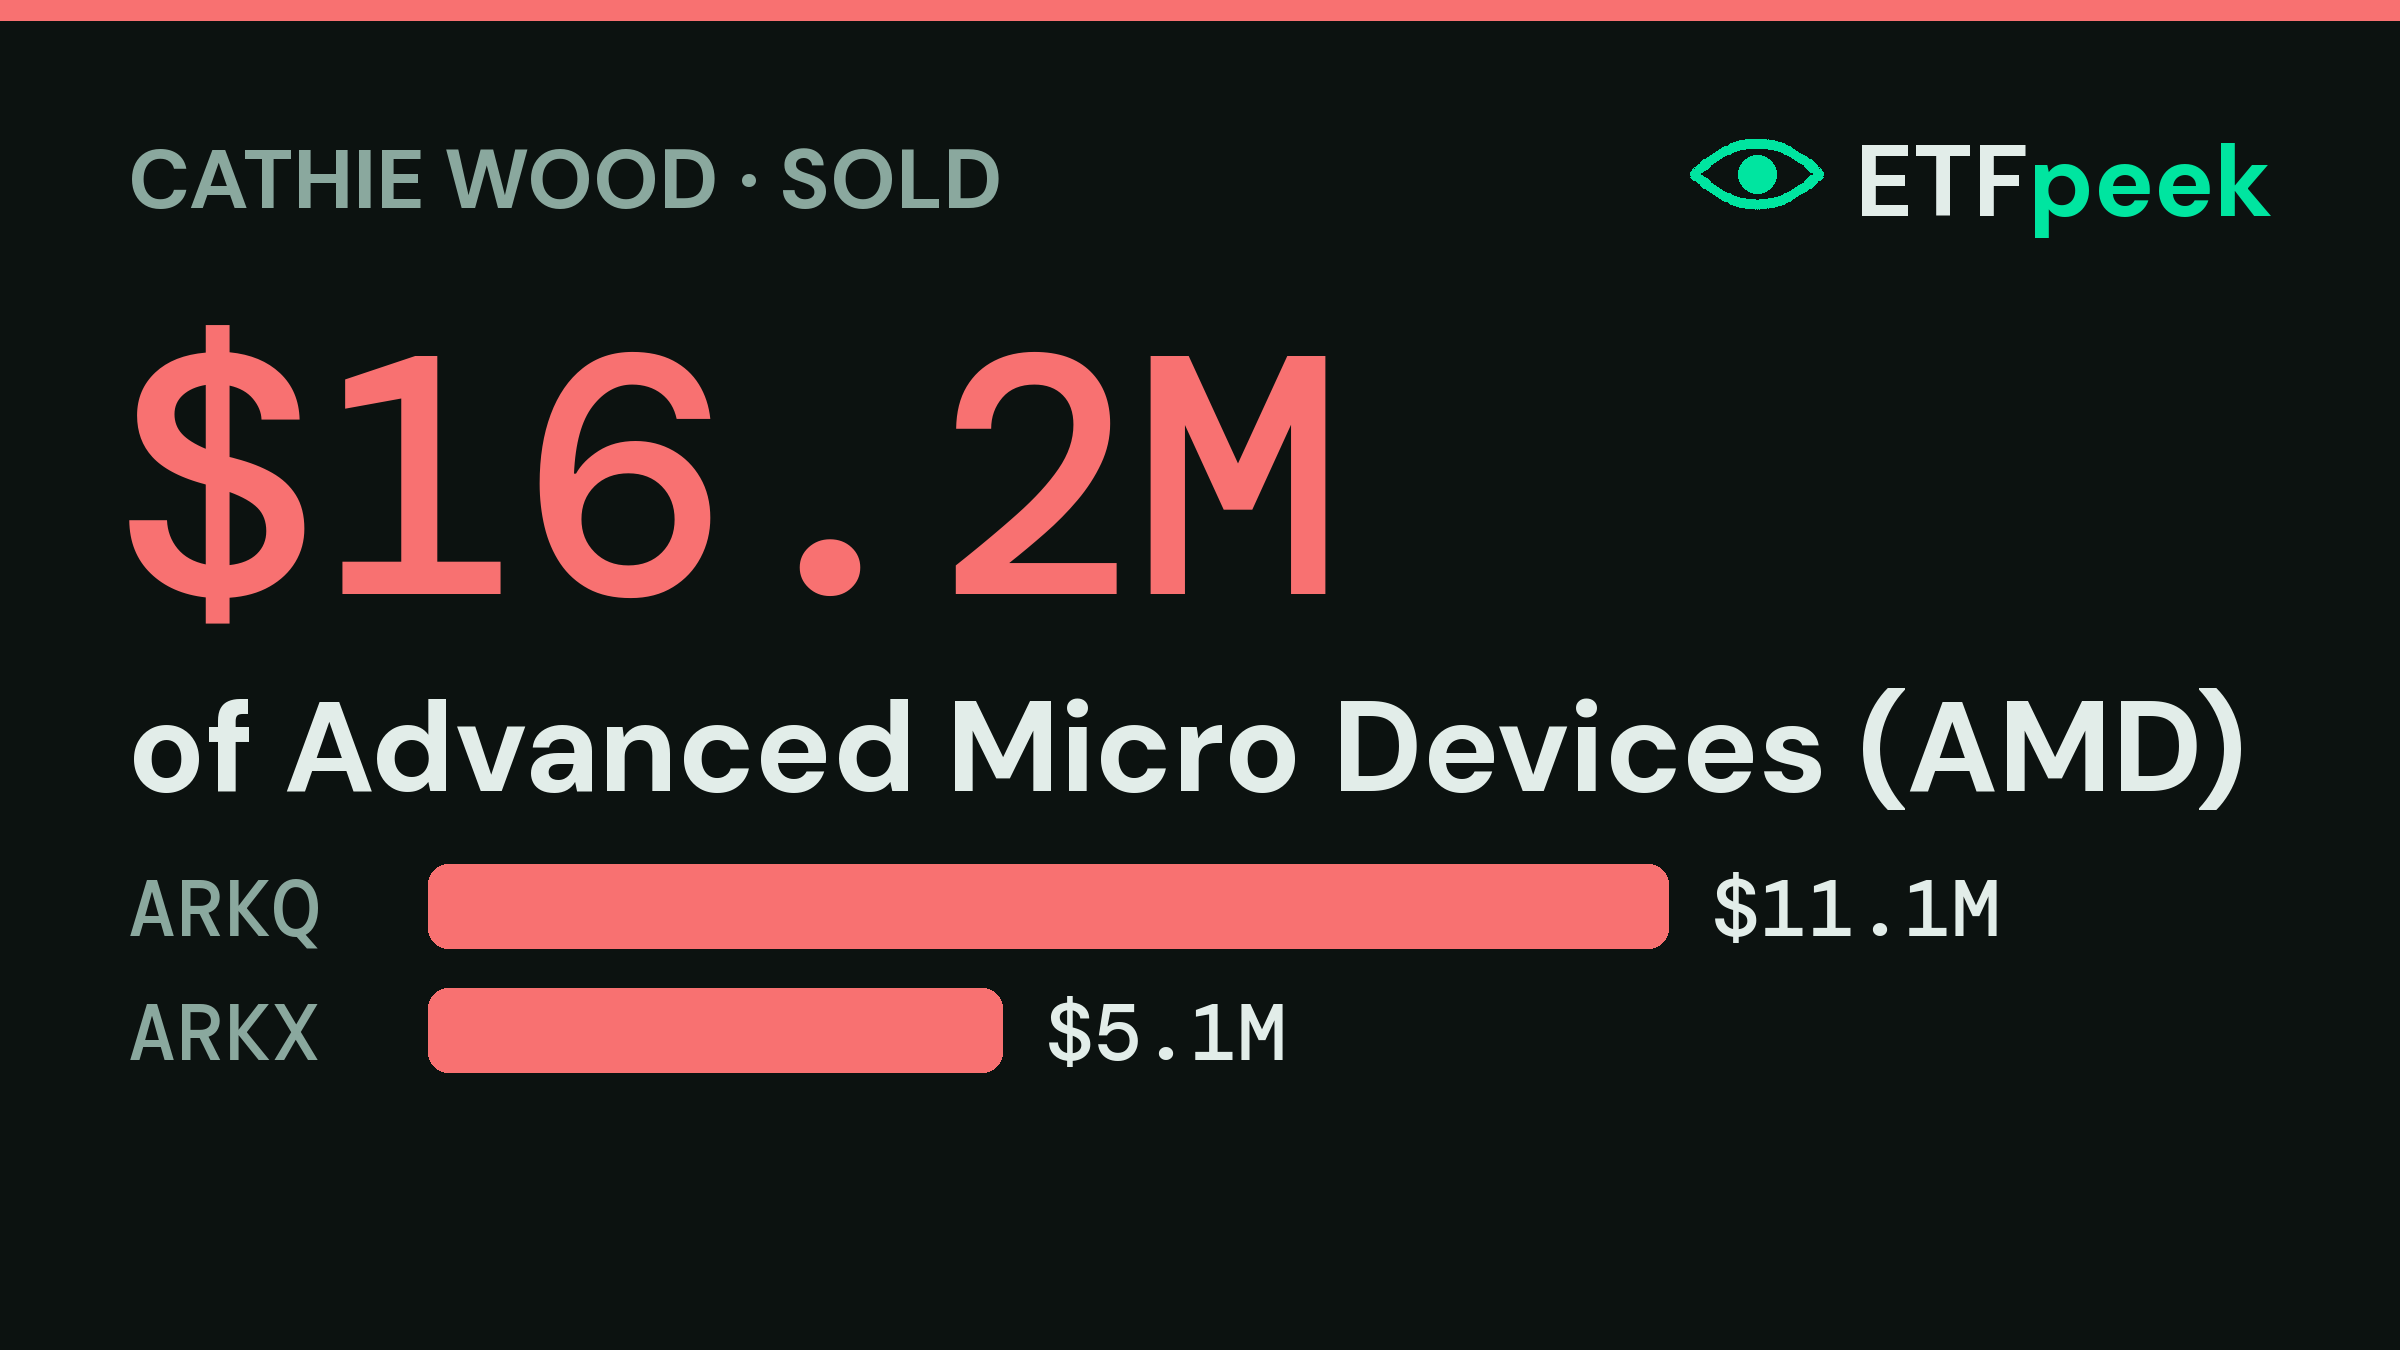
ARK sold roughly $16.2M of Advanced Micro Devices (AMD) on 28 Oct 2026, spread across ARKQ and ARKX. It was the largest single trade ARK made that day.
Nothing in the fund flows explains this one — the 20% move was a call.
Over the last 30 days ARK has been a net seller of Advanced Micro Devices — $155.7M across 10 trades.
Everything ARK did on 28 Oct 2026
ARK made 9 real moves that day, once money flowing in and out of the funds is stripped out:
| Stock | Funds | Est. value |
|---|---|---|
| AMD Advanced Micro Devices | ARKQ and ARKX | −$16.2M |
| TSM Taiwan Semiconductor-Sp ADR | ARKQ and ARKX | −$10.6M |
| AVAV Aerovironment Inc | ARKQ and ARKX | +$9.8M |
| KTOS Kratos Defense & Security | ARKQ and ARKX | +$5.7M |
| JOBY Joby Aviation Inc | ARKQ and ARKX | +$4.4M |
| BEAM Beam Therapeutics Inc | ARKG | +$2.3M |
The bigger picture: ARK's last 30 days
The 30-day picture: Nvidia Corp ($81.0M), CoreWeave Inc ($74.9M), Veracyte Inc ($39.0M) have taken the most new money. Going the other way: Advanced Micro Devices ($155.7M), Personalis Inc ($92.6M), 10X Genomics Inc ($69.6M) have been cut.
Is it working?
ARKQ is trailing the index this year: +1.7% versus +13.7%.
ARKQ has lagged the index by 6 points over the past month (-6.2% vs -0.2%). Most of the damage came from Teradyne Inc (-19%, 7% of the fund), Rocket Lab (-21%, 4% of the fund), Archer Aviation Inc (-25%, 3% of the fund).
The last 12 months tell a different story — ARKQ -3.5% versus the index's +13.5%, a 17-point gap.
Over five years the gap is 39 points. ARKQ is 19% below its all-time high from May 2026, having fallen as much as 24% at its worst in Jul 2026.
| To date | 1 month | YTD | 1 year | 5 years |
|---|---|---|---|---|
| ARKQ | -6.2% | +1.7% | -3.5% | +42.0% |
| S&P 500 (SPY) | -0.2% | +13.7% | +13.5% | +81.3% |
| Nasdaq-100 (QQQ) | -3.1% | +17.7% | +15.3% | +95.4% |
How we work this out
ETFpeek is an independent research tool and is not affiliated with ARK Invest or Cathie Wood. Figures are estimates from public fund data, shown for information only — not financial advice. Past performance does not indicate future results.