Robinhood Markets Inc falls 10% in a week and Cathie Wood's ARK adds $7.5M
A falling price didn't stop ARKF and ARKK buying more. Here are the day's other moves, and how ARK is doing against the market.
Generated from ARK's own holdings data.
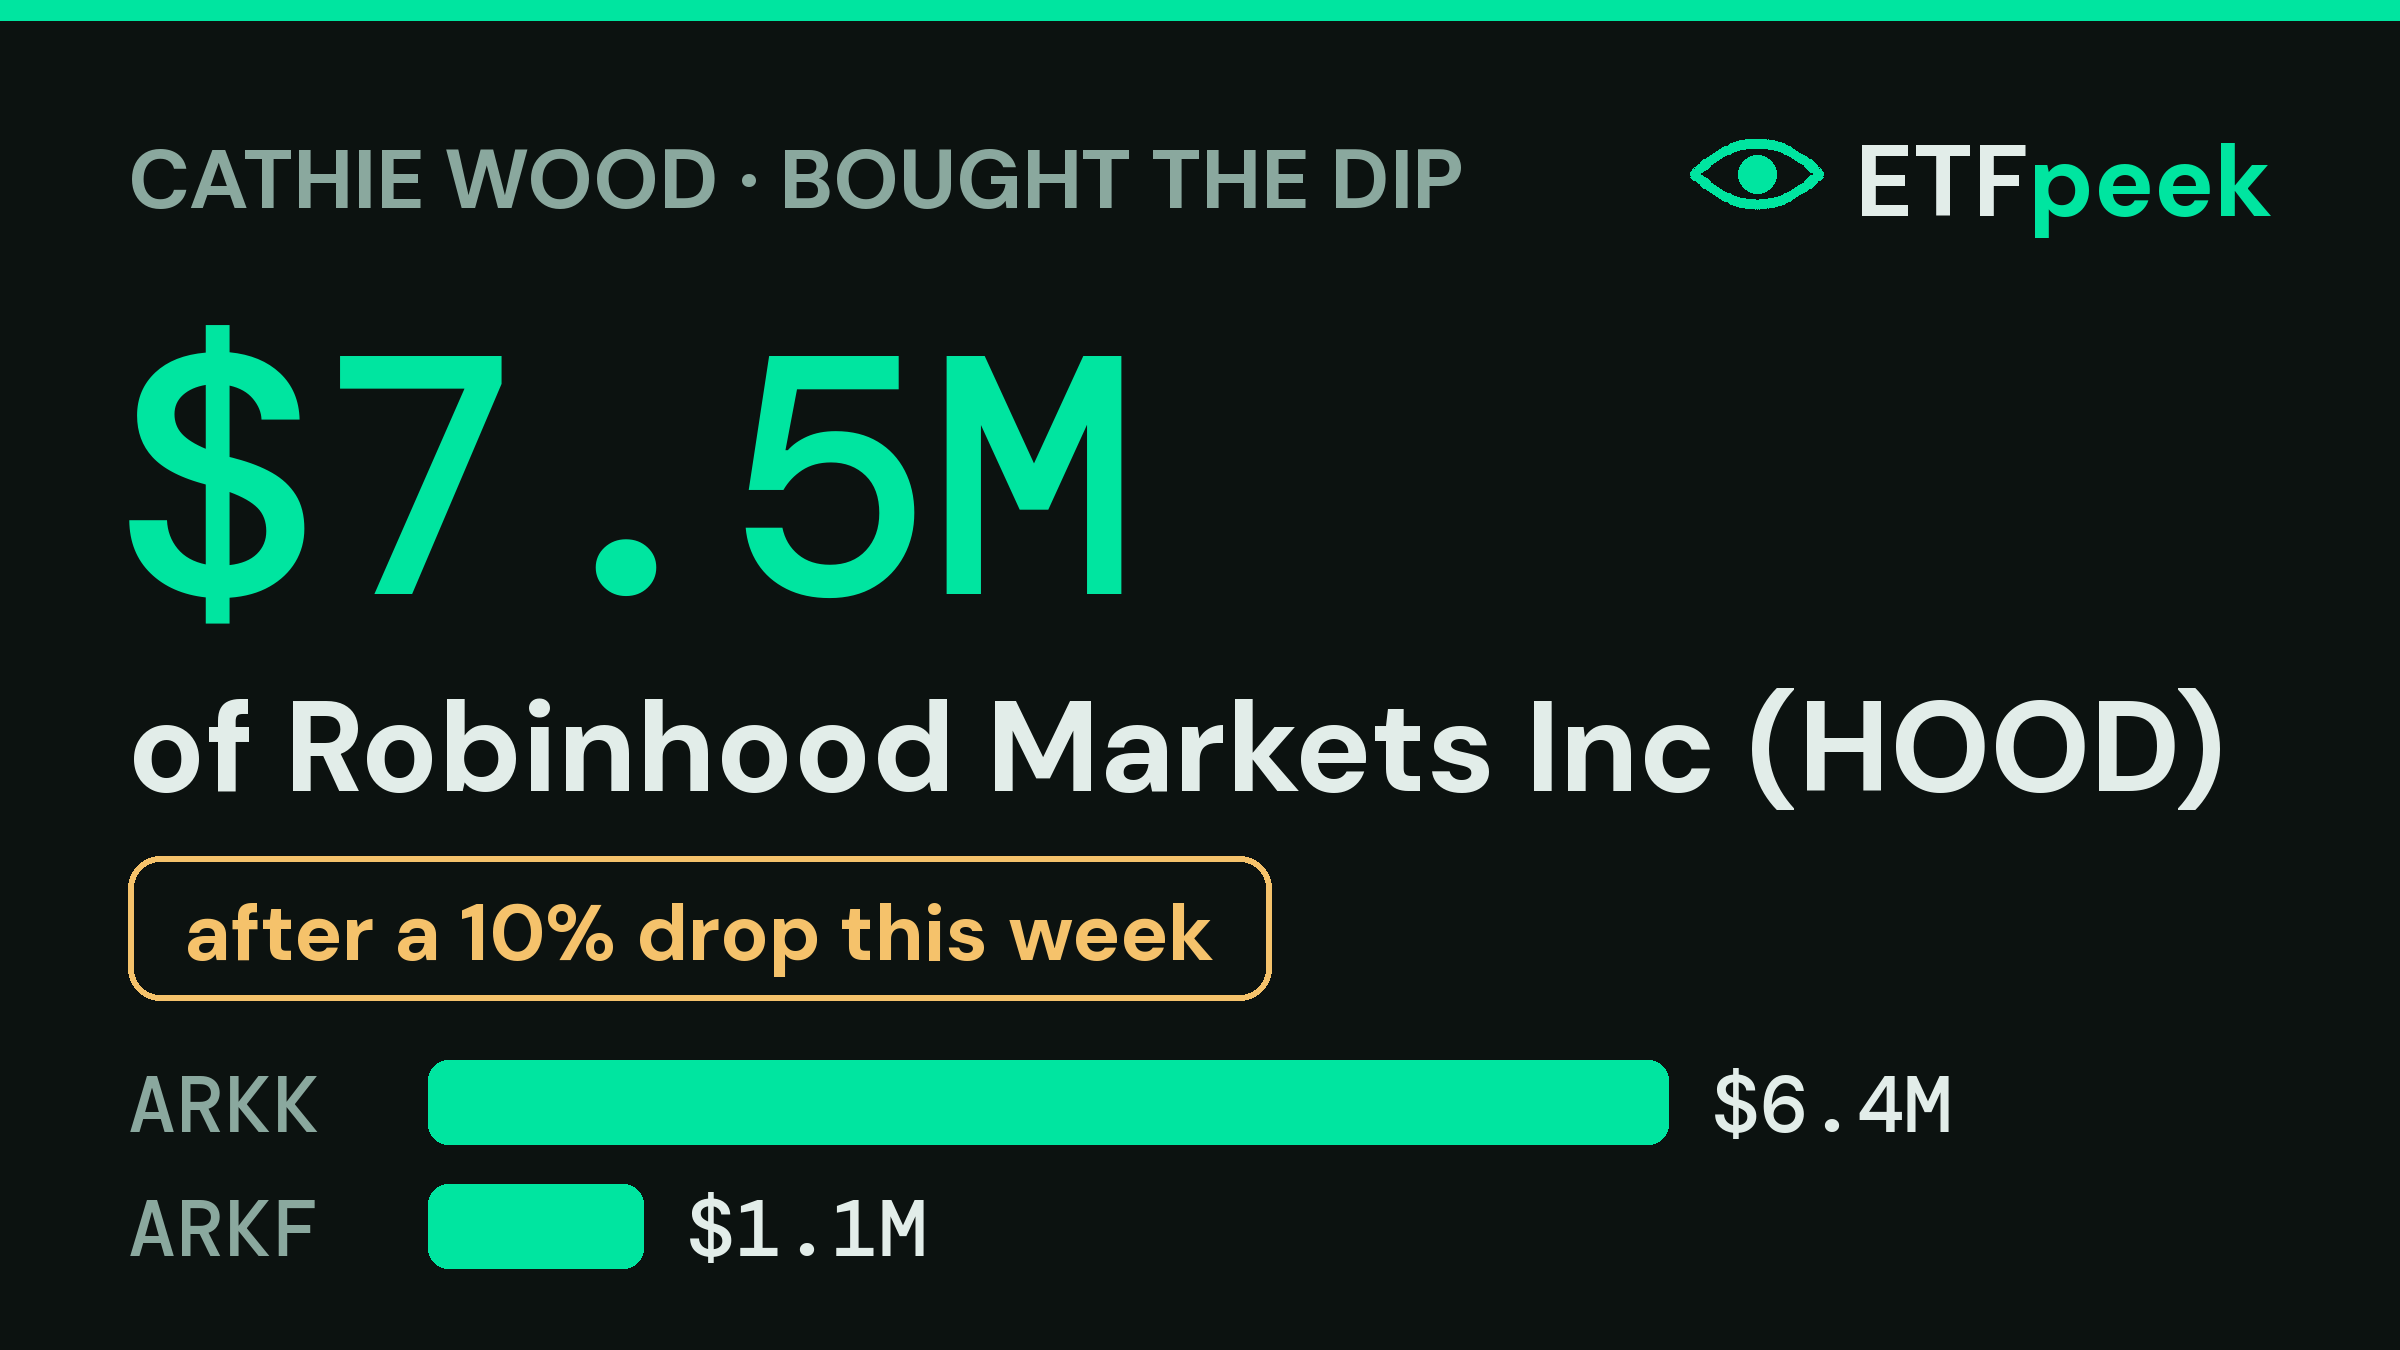
An estimated $7.5M of Robinhood Markets Inc (HOOD) was bought by ARKF and ARKK on 29 Oct 2026. It came after a 10% drop over the previous week.
Every other holding shrank by about 3.2% that day as money left the funds. This position grew by 3% — the gap is what makes it a deliberate trade rather than cash being spread across the portfolio.
It goes against the trend: the month still shows a net $46.3M sold across 9 trades.
Everything ARK did on 29 Oct 2026
ARK made 12 real moves that day, once money flowing in and out of the funds is stripped out:
| Stock | Funds | Est. value |
|---|---|---|
| TER Teradyne Inc | ARKK, ARKQ and ARKX | +$23.4M |
| HOOD Robinhood Markets IncBought after a 10% drop this week | ARKF and ARKK | +$7.5M |
| TWST Twist Bioscience Corp | ARKK | −$7.3M |
| CBRS Cerebras Systems Inc | ARKK | +$5.1M |
| TSM Taiwan Semiconductor-Sp ADRSold 3 days running | ARKQ and ARKX | −$4.7M |
| TEM Tempus AI Inc | ARKK | −$4.5M |
The bigger picture: ARK's last 30 days
Zoom out to 30 days and ARK's largest net purchases are Nvidia Corp ($81.0M), CoreWeave Inc ($74.9M), Veracyte Inc ($39.0M). On the other side, it has been cutting Advanced Micro Devices ($159.0M), Personalis Inc ($92.6M), 10X Genomics Inc ($73.6M).
Is it working?
This year ARKK is behind the market — +12.0% against +14.1% for the S&P 500.
Over the past year the gap is wider: ARKK returned -3.5% against +13.6% for the S&P 500, 17 points apart.
That five-year gap — 108 points — mostly comes down to timing. Five years ago ARKK was trading close to its all-time high of Feb 2021. It then fell 81% to its low in Dec 2022, and it is still 44% below that peak today. Any comparison that starts near the top of that boom looks brutal.
| To date | 1 month | YTD | 1 year | 5 years |
|---|---|---|---|---|
| ARKK | -3.5% | +12.0% | -3.5% | -28.1% |
| S&P 500 (SPY) | +0.9% | +14.1% | +13.6% | +80.2% |
| Nasdaq-100 (QQQ) | -1.5% | +18.4% | +15.1% | +94.4% |
How we work this out
ETFpeek is an independent research tool and is not affiliated with ARK Invest or Cathie Wood. Figures are estimates from public fund data, shown for information only — not financial advice. Past performance does not indicate future results.